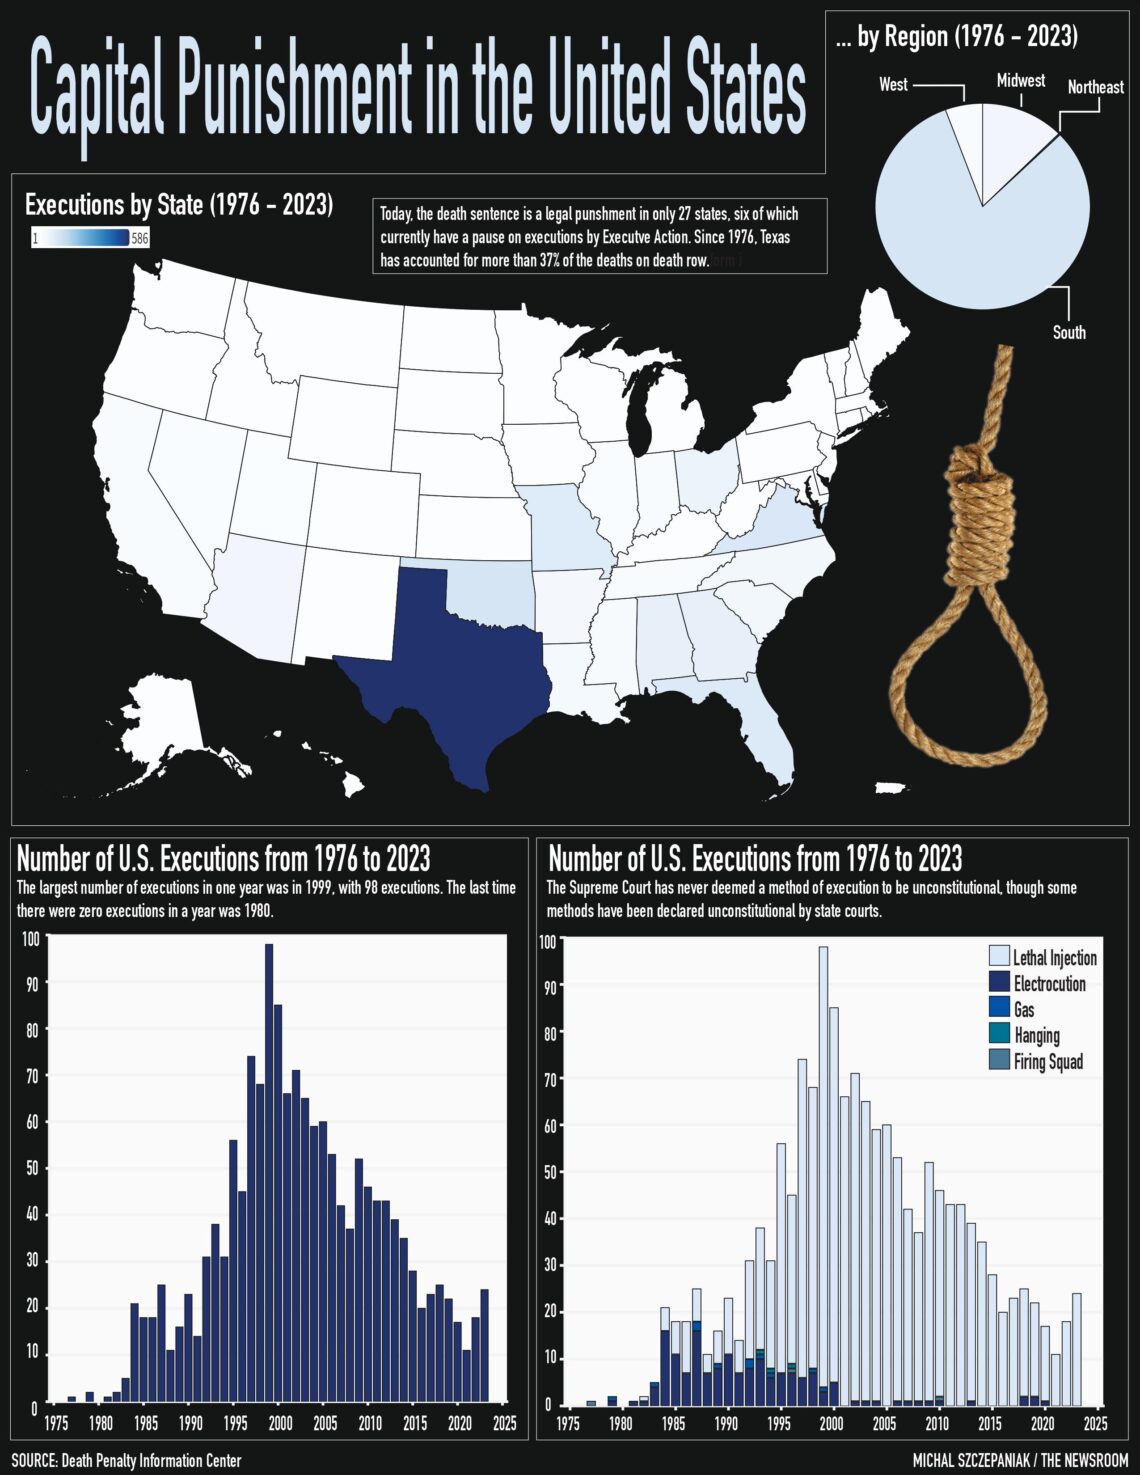
This is an infographic I designed for my JOUR 425: Multimedia Editing & Design class using Microsoft Excel and Adobe Illustrator. The infographic displays three different visualizations of information presented by the Death Penalty Information Center from 1976 to 2023, including a map highlighting the number of executions by state, a pie chart showing the number of executions by region, a bar chart with the number of executions by year, and a stacked bar chart displaying the different methods of execution.